Not translated yet — showing English.
Platform Health
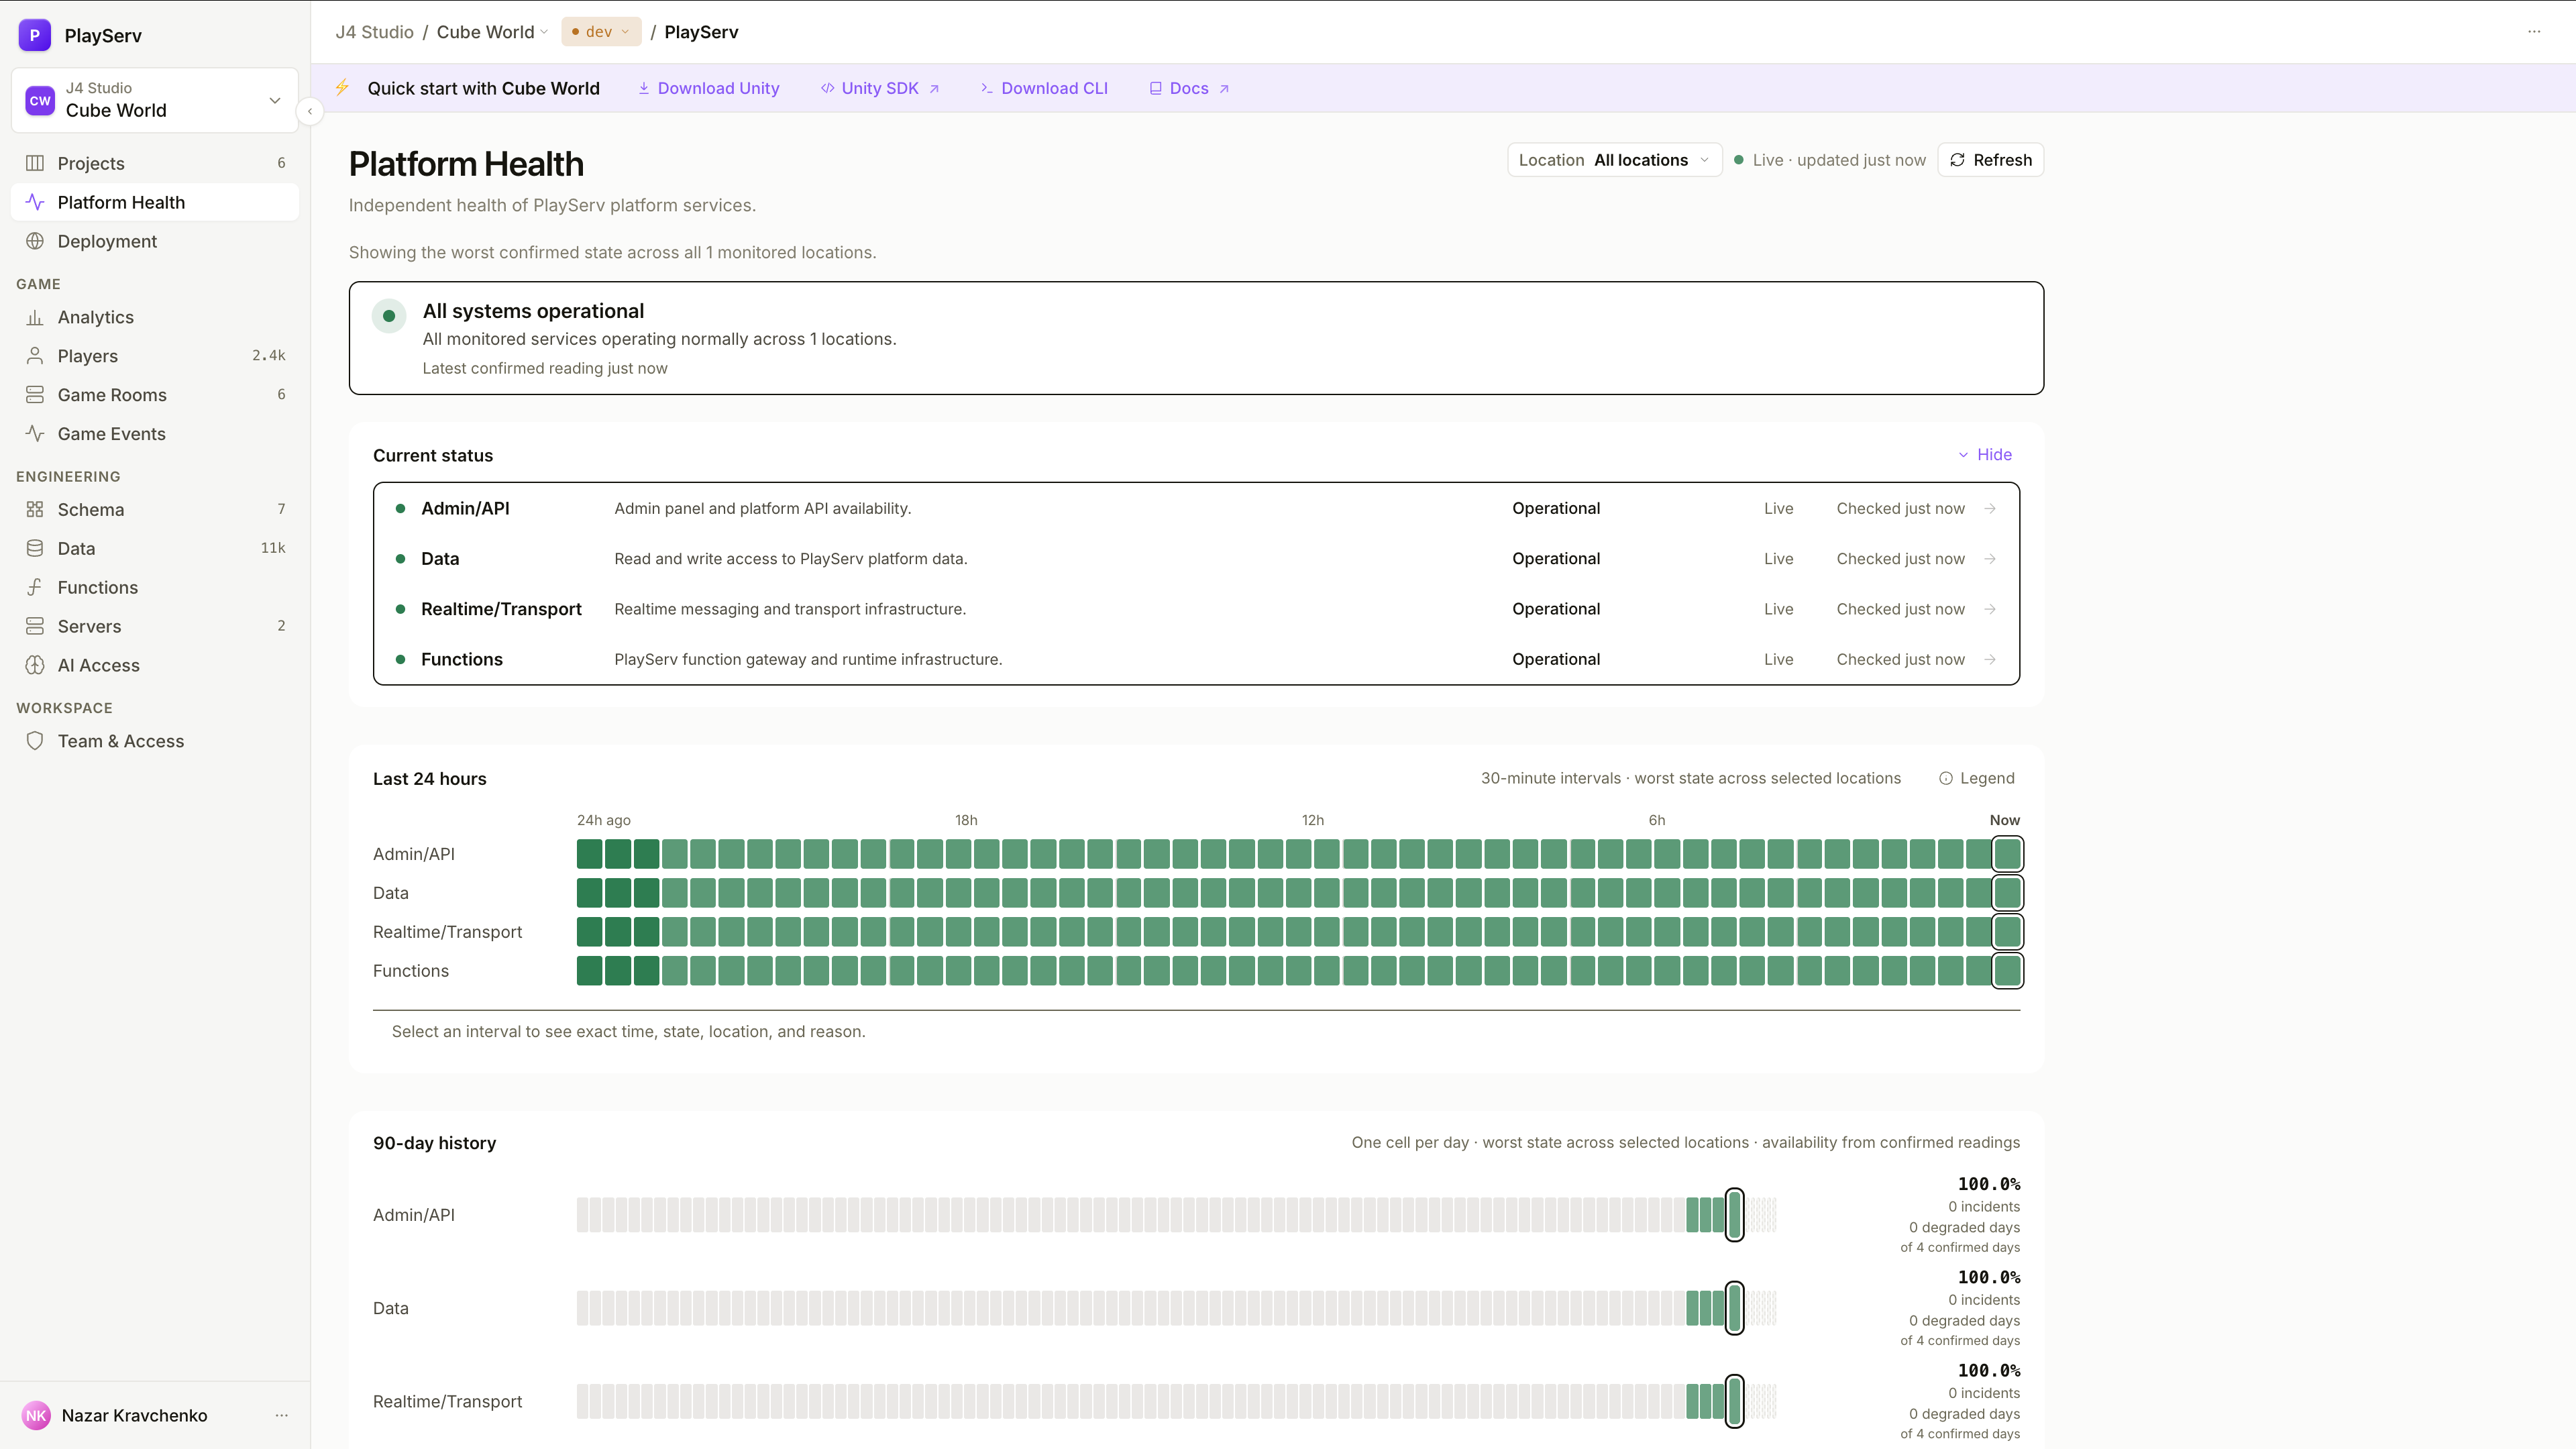
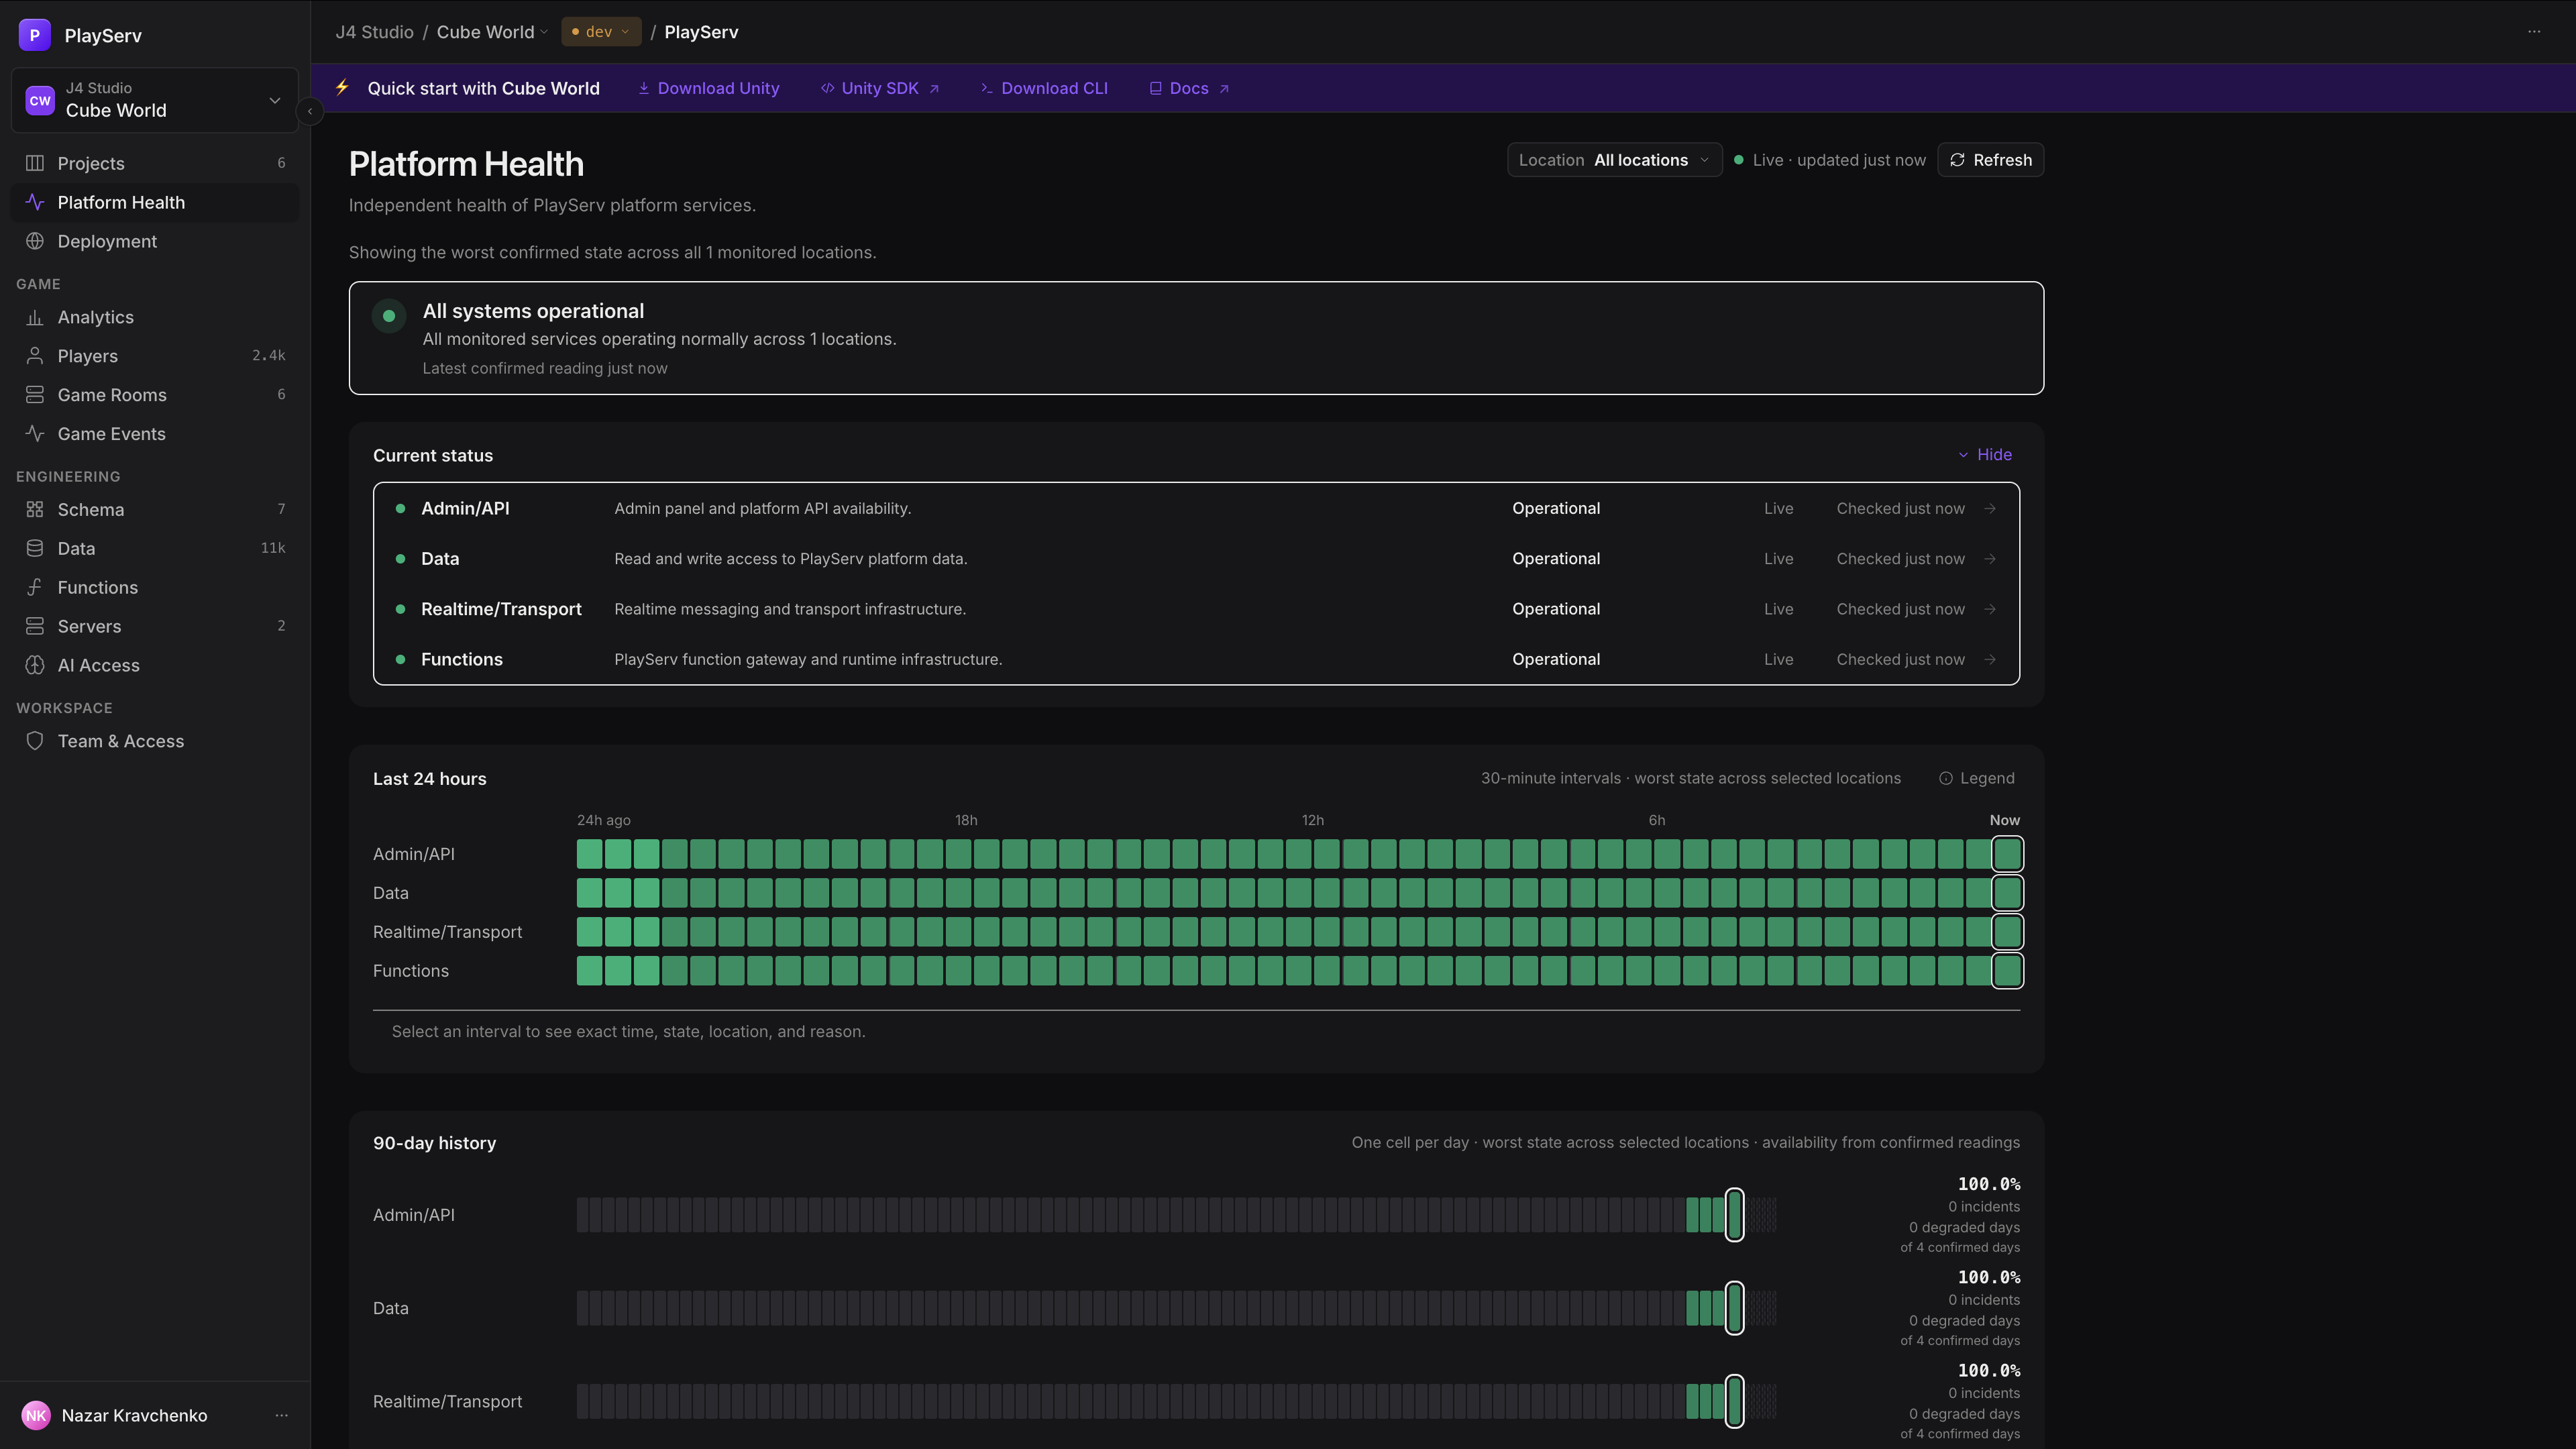
Platform Health tells you whether PlayServ itself is healthy, before you start debugging your game. It shows the live state and 90-day availability of the four platform systems in every location. An independent monitor measures them from outside the cluster, so the page stays truthful even when the platform is struggling. The page is read-only.
What it measures
Four platform systems, in every location you can see.
| System | What it covers |
|---|---|
| Admin/API | Admin panel and platform API availability. |
| Data | Read and write access to PlayServ platform data. |
| Realtime/Transport | Realtime messaging and transport infrastructure. |
| Functions | PlayServ function gateway and runtime infrastructure. |
A location is a point of presence. On a shared cluster the page covers every location; on a dedicated cluster it covers only that cluster's own.
Your own game isn't measured here
Platform Health covers PlayServ's systems only. The health of your game servers and functions lives in Servers and Functions.
Every reading carries two signals: the state, and how fresh it is.
| State | Meaning |
|---|---|
| Operational | The system is serving normally. |
| Degraded | The system works, with reduced availability. |
| Down | The system is not serving traffic. |
| No data | The monitor has no reading for it. |
| Confidence | Meaning |
|---|---|
| Live | The last check was less than 5 minutes ago. |
| Stale | The last check was 5 or more minutes ago, so the state may have changed since. |
| Never reported | The monitor has never read this system in this location. |
Stale is not degraded
A stale reading makes health unknown, not worse. The page keeps the two apart: locations with stale readings are listed under Monitoring confidence reduced instead of being counted as problems, and a card whose readings are stale is marked Unconfirmed.
How the views roll up.
| View | What it shows |
|---|---|
| All locations | The worst confirmed state across every location: Down outranks Degraded, which outranks Operational. Locations without data are left out. |
| One location | That location only; the others don't affect the view. |
| 24-hour segment | The worst state within 30 minutes. |
| 90-day cell | The worst state of the day. |
| Availability | Lost days out of counted days. A Down day counts as one lost day, a Degraded day as half. Days without data aren't counted. |
| Incident | In the 90-day history, a run of consecutive Down days. |
During an incident, narrow to one location
All locations shows the worst state anywhere, so one bad location turns the whole view red. Pick the location your players connect to under Location to see whether they are actually affected.
Reading the page
The page refreshes every 30 seconds. The pill next to Refresh says how recent the data is, for example "Live · updated just now" or "Some readings stale". Switch between all locations and a single one with Location.
| Block | What it tells you |
|---|---|
| Overall status | One headline for the whole view — All systems operational, Some systems are degraded, Service disruption or No status data — with how many systems and locations are affected and when the latest reading was confirmed. If every reading is stale, it says Health cannot be fully confirmed. |
| Needs attention | A card for every Degraded or Down system: the reason the monitor recorded, the affected locations, how long it has lasted and when it was last confirmed. Unconfirmed marks a card whose readings are stale. Expected recovery reads No estimate yet: the monitor records incidents, not recovery estimates. |
| Current status | The systems that are fine, with their confidence and last check. Collapse it with Hide. When other systems need attention, this block is titled Operating normally. |
| Monitoring confidence reduced | Locations whose readings are stale or missing, grouped by location. |
| Last 24 hours | 48 half-hour segments per system. Select one to see its exact time range in UTC, state, locations, duration, reason and whether the reading was confirmed. |
| 90-day history | A cell per day per system, with availability, incidents, degraded days and the number of days with confirmed data. Select a day to see its worst state, location and reason. |
If the monitor can't be reached, a banner says so and the page keeps showing the last successful reading with its age, until Try again succeeds.
System details
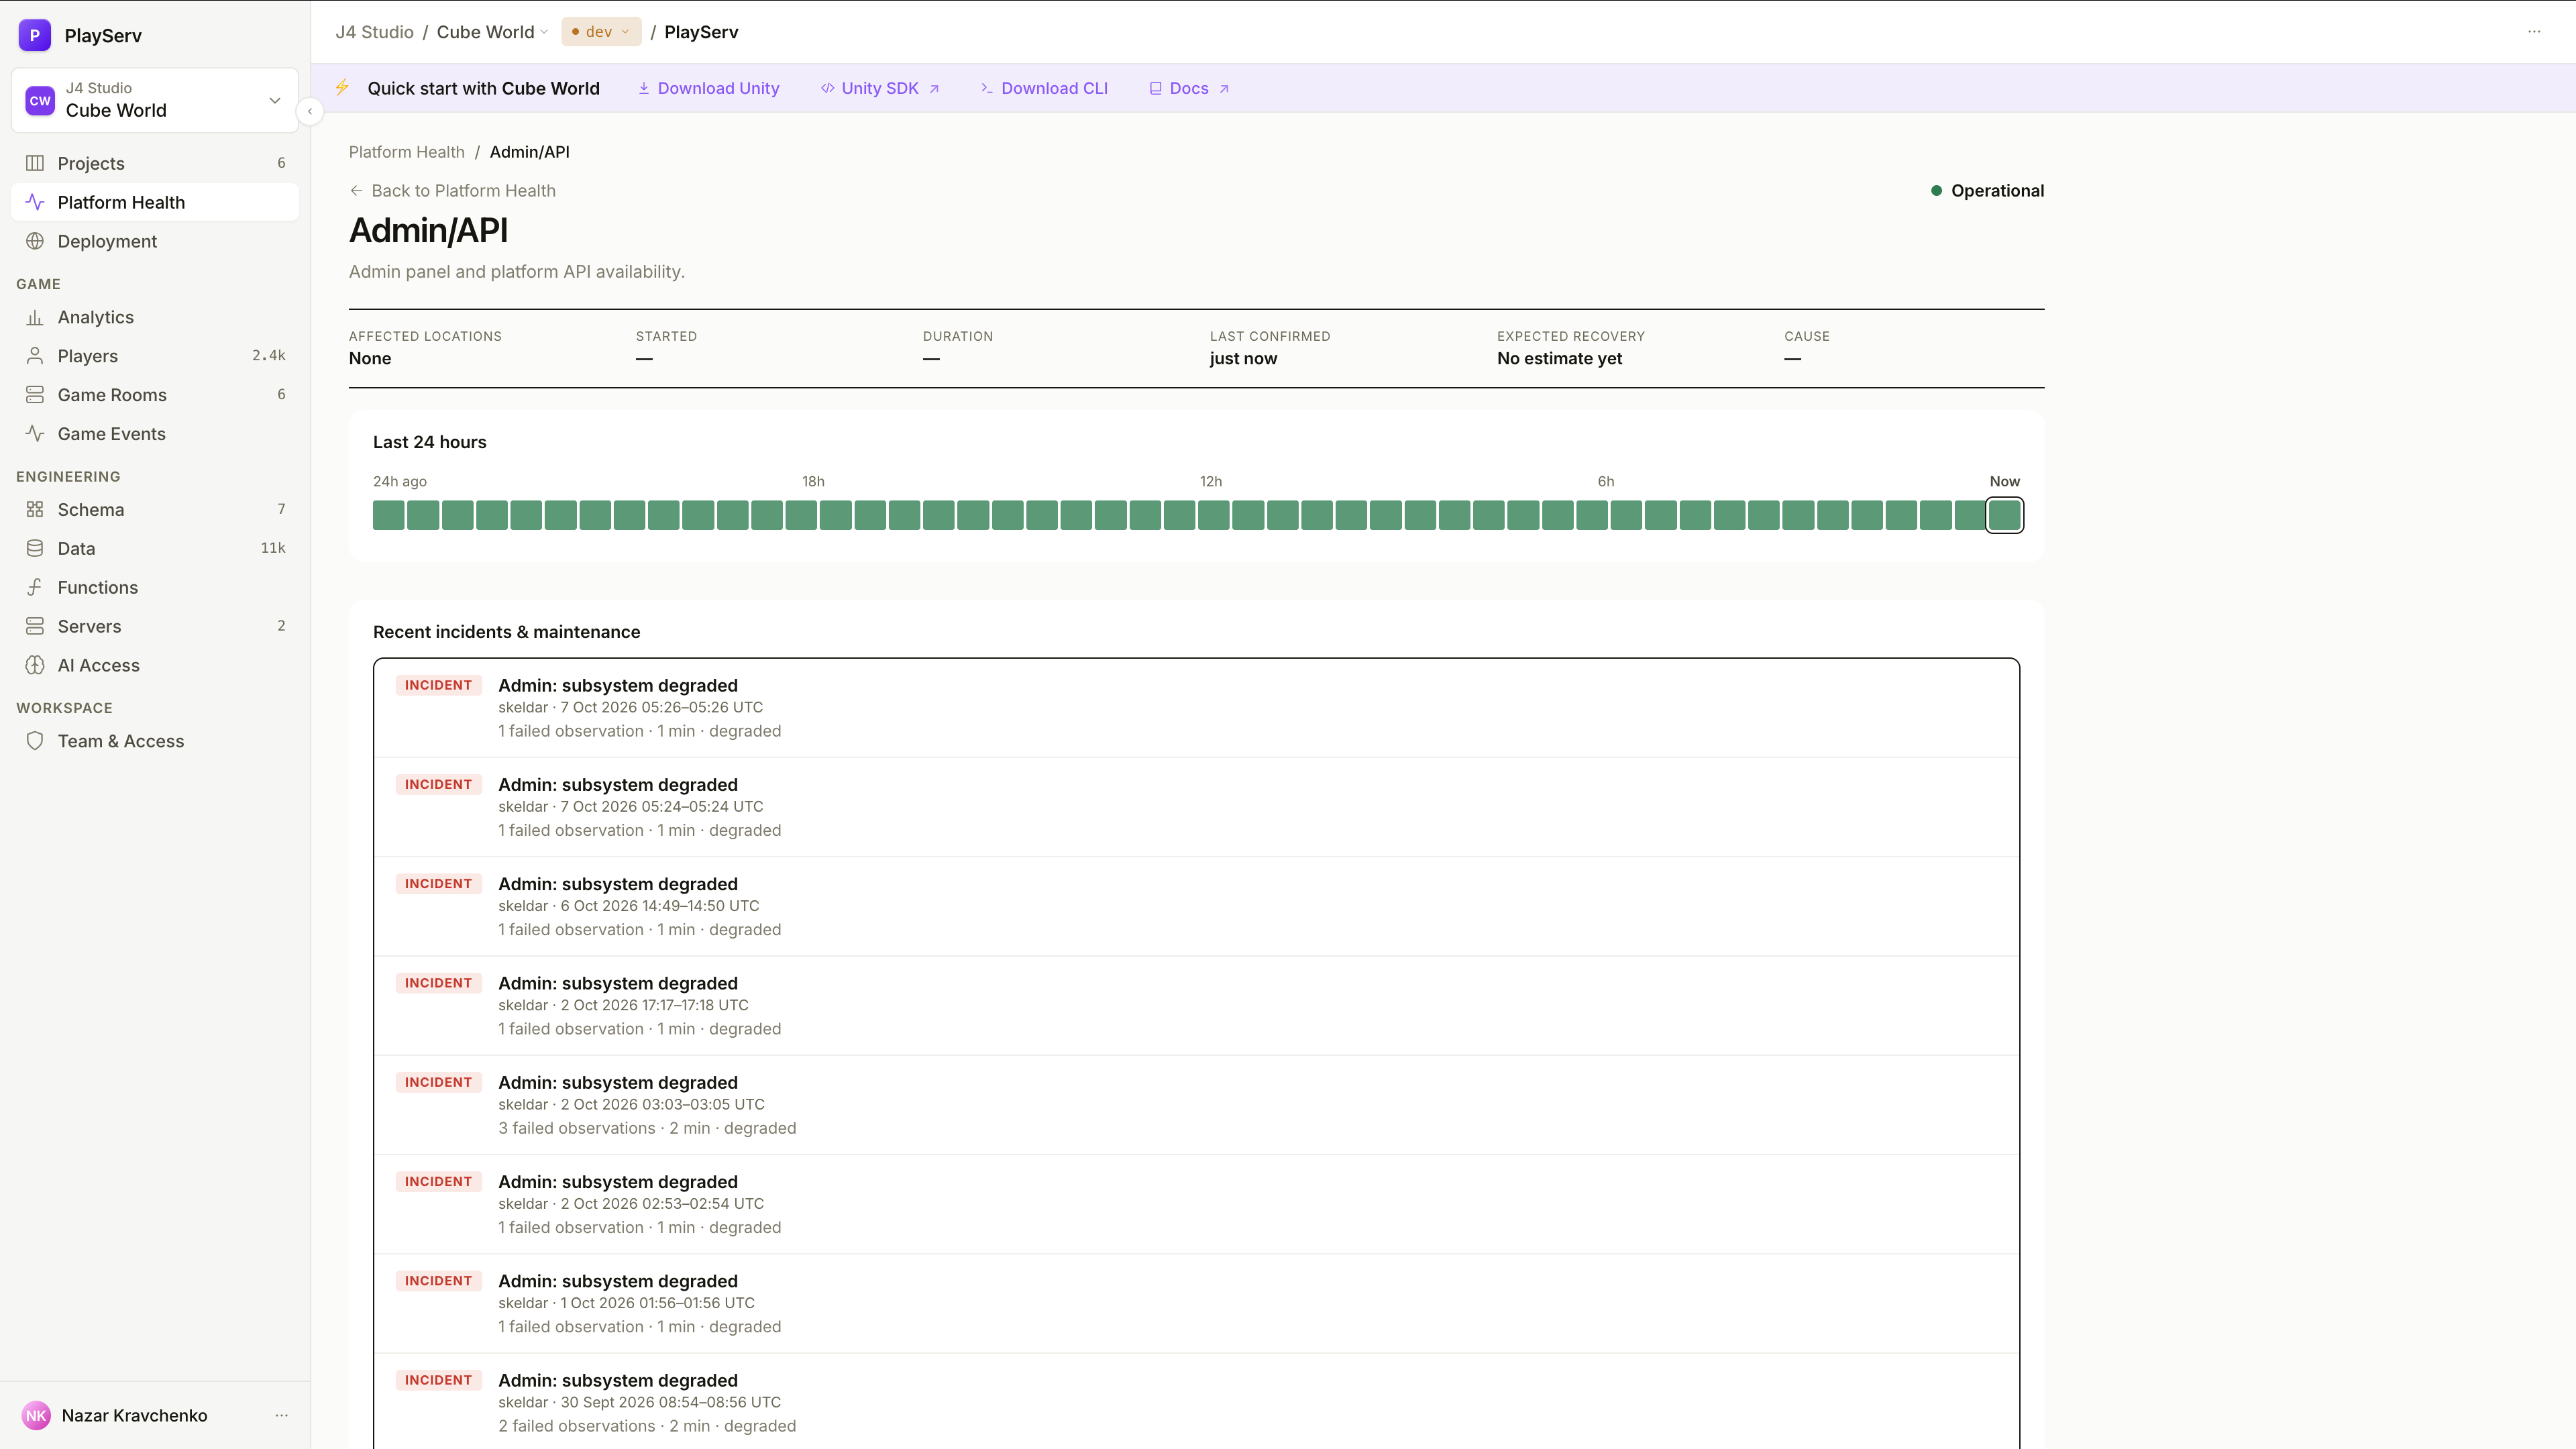
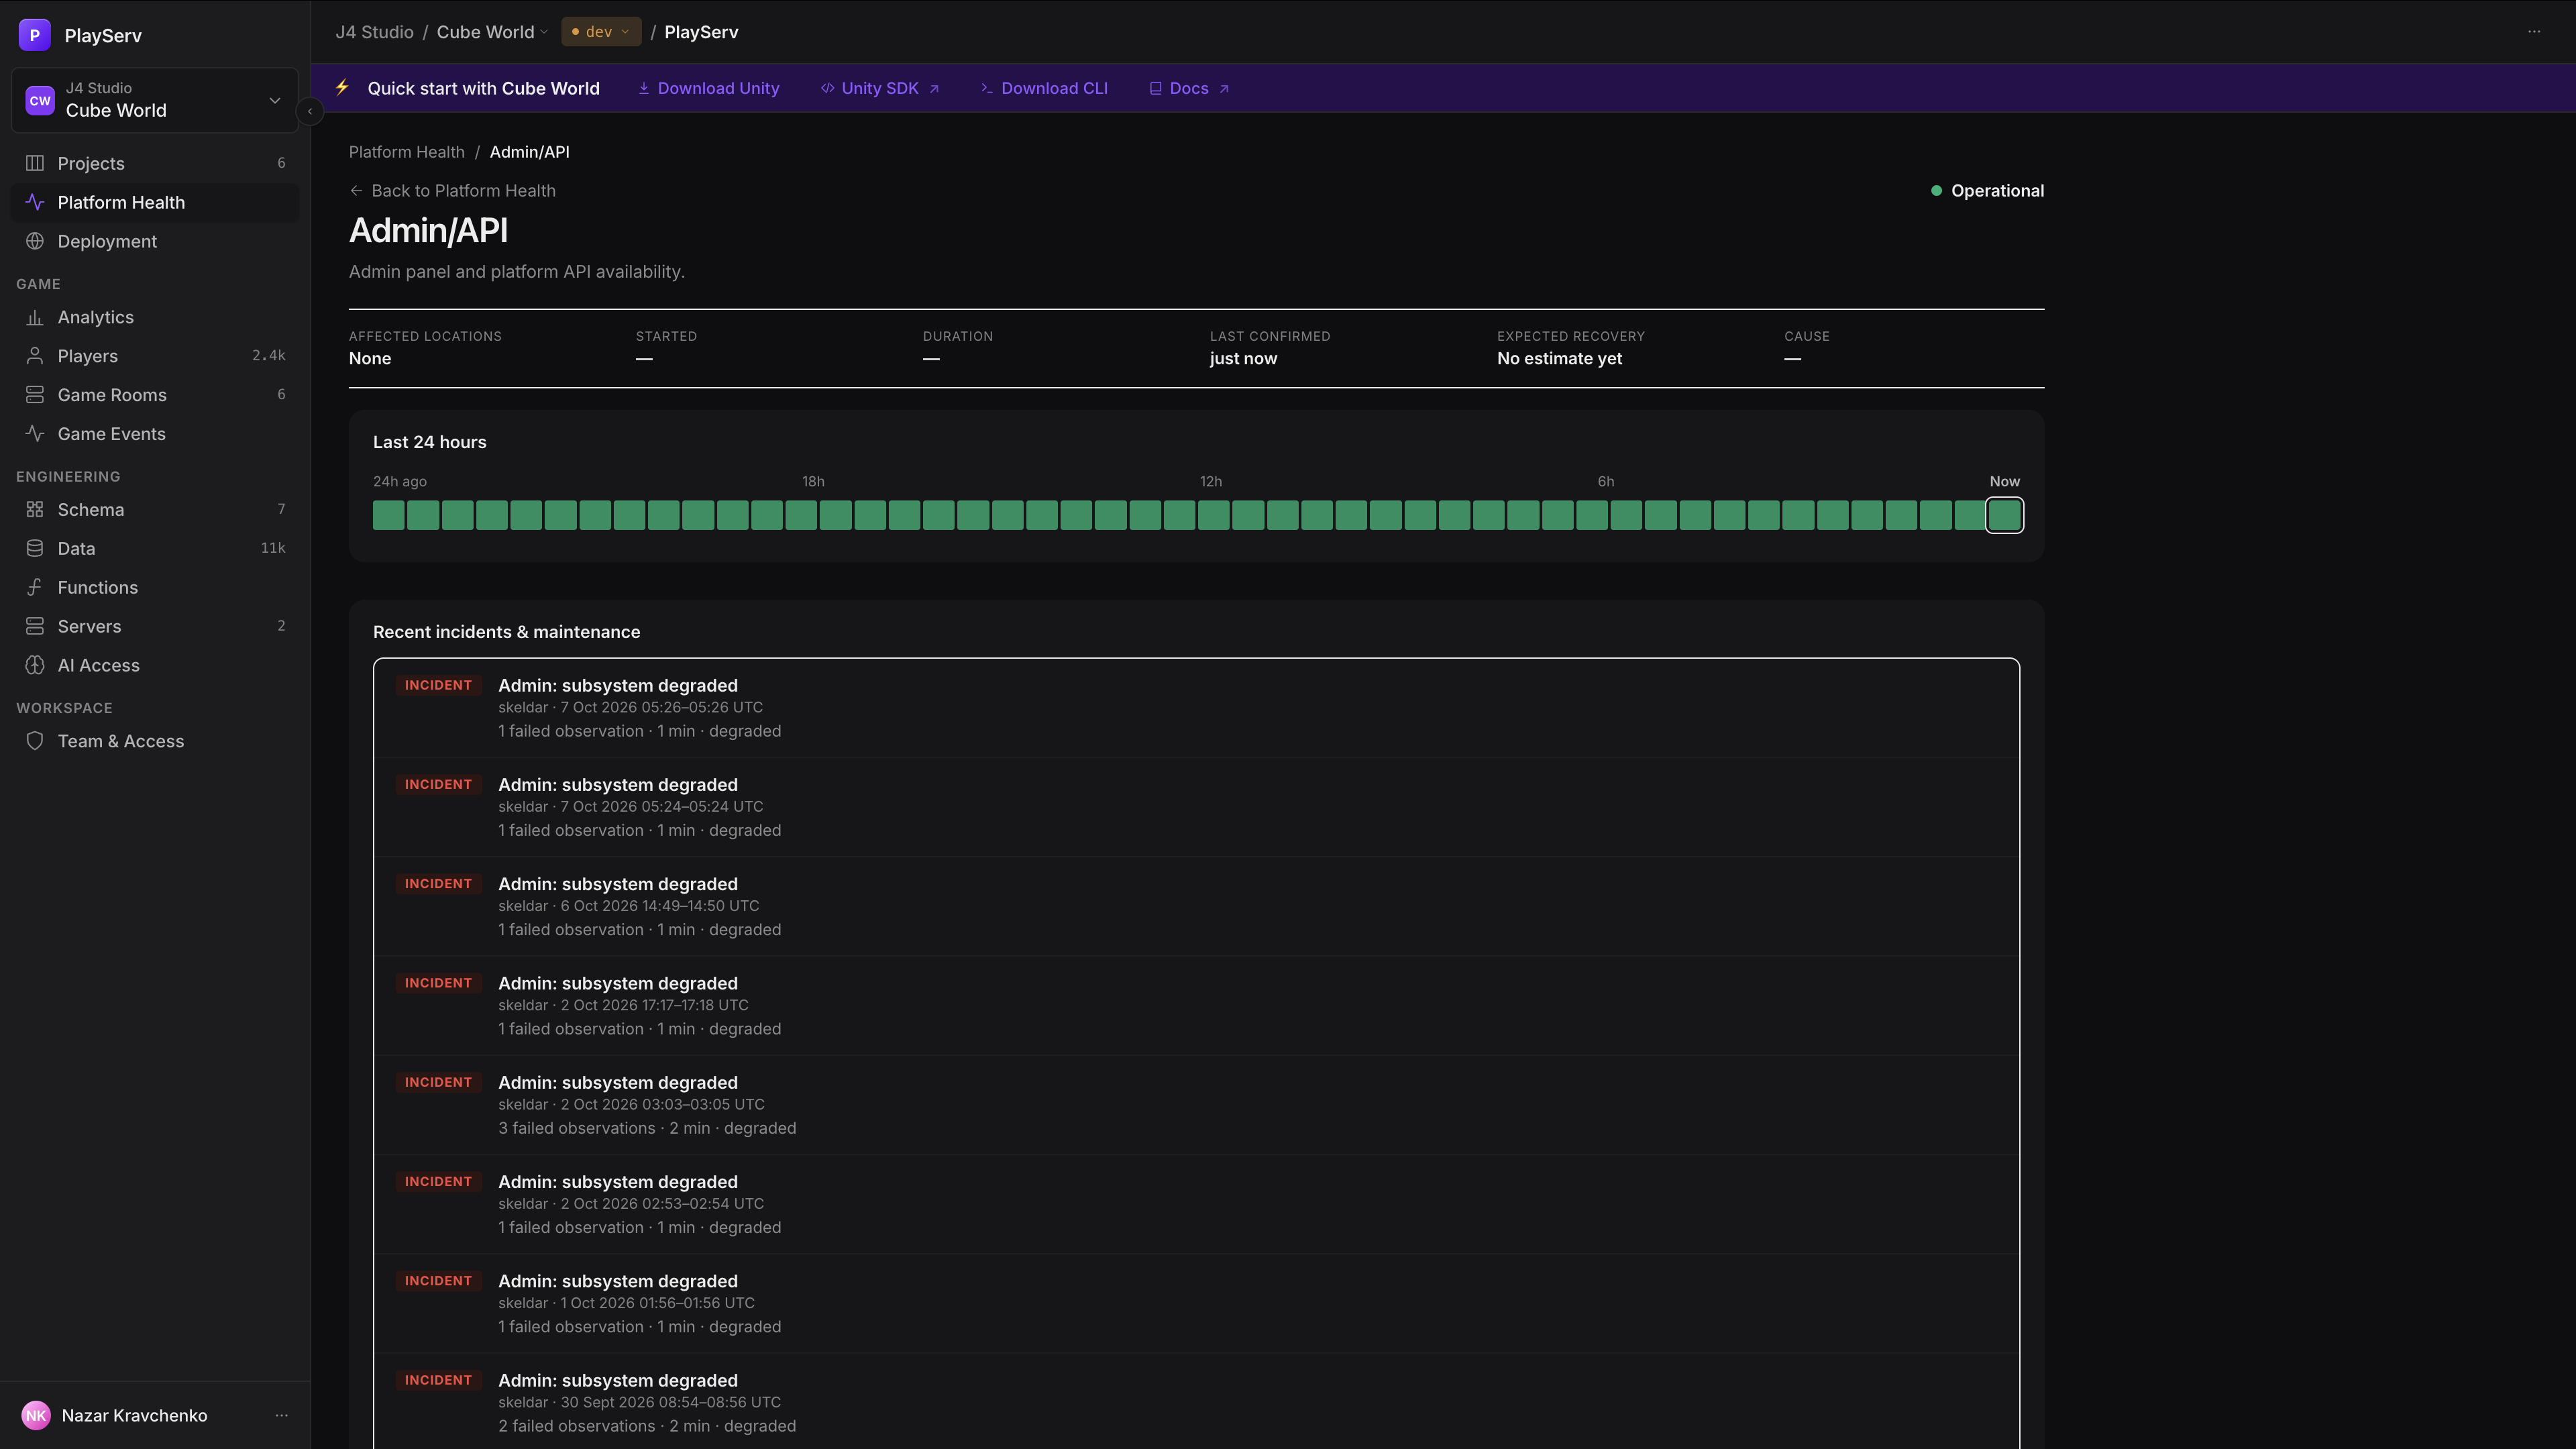
One system, in depth. Open it with View details on a card or Open system details on a selected segment.
| Field | What it shows |
|---|---|
| Affected locations · Started · Duration | The scope and age of the current problem. None and dashes mean there is no problem. |
| Last confirmed | When the monitor last read this system. |
| Expected recovery · Cause | The cause the monitor recorded; recovery is always No estimate yet. |
| Last 24 hours | The same half-hour timeline, for this system only. |
| Recent incidents & maintenance | Each incident the monitor recorded, with its location, time range in UTC, number of failed observations, duration and severity. |
| Monitoring per location | The reading for this system in each location. |
Platform Health and the public status page
Both report platform health, for different readers.
| Platform Health | Public Status Page | |
|---|---|---|
| Who sees it | Your team, signed in to the Backoffice | Anyone, no credentials |
| Detail | Per system and location, with reasons, history and incidents | A coarse current state, recent history and federation |
| Use it for | Deciding during an incident whether the cause is the platform or your game | Uptime monitors, and links from a game or support page |
Next steps
- Deployment — where your project serves players, and which locations need attention
- Servers — the health of your own game-server fleets
- Public Status Page — the public, unauthenticated status endpoint
Last updated on 10 Oct 2026